AIM: How can graphs help us make political decisions?
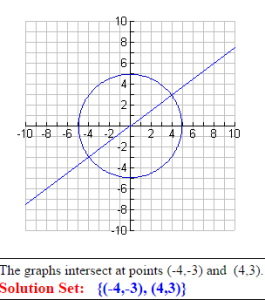
Today we continued with systems of equations where one equation produces a circle and the other produces a line. Check the earlier Lesson on circle equations for help graphing circles.
To graph and solve these types of systems we need to follow a few steps:
1. Graph the circle by hand.
2. Graph the line using a calculator. (or by hand if you are comfortable with it)
3. Clearly label the intersection points.
You haven’t actually answered the question unless you label the intersection points clearly as your solution.
For example:
In the classwork we have to make a decision. The city government is planning to build a street dangerously close to McCarren park. Graphing the two equations will help us decide whether to support or oppose the government’s decision.
[gview file=”https://www.whsad.org/wp-content/uploads/2015/01/Lesson-8-Activity-Sheet.docx”]

